QuEStVar v0.1.0 is out
The package grew out of the 2024 J. Proteome Res. paper. The analysis lived in a monolithic GitHub archive until last week. v0.1.0 is the clean API extraction of that work.
The core point is one that keeps getting missed in omics: a non-significant t-test is not evidence of equivalence. It is a failure to reject. QuEStVar runs a TOST (two-one-sided t-test) alongside the standard test so the result is always one of three states: differential, equivalent, or genuinely indeterminate. The indeterminate case is important to surface explicitly rather than letting it collapse into "not significant."
The other thing I spent time on is the exclusion tracking. Features excluded before testing (bad CV, missing values, zero variance) appear in their own panel with a breakdown by reason. Most tools drop them silently. Knowing why a feature was excluded matters when you are interpreting the overall result counts.
import polars as pl
from questvar import QuestVar

df = pl.read_csv("data/demo_realistic.tsv", separator="\t")
qv = QuestVar(cv_thr=1.0, eq_thr=0.5, df_thr=1.0, p_thr=0.05, correction="fdr")
results = qv.test(df, cond_1=["c1_0","c1_1","c1_2"], cond_2=["c2_0","c2_1","c2_2"])
print(results.summary())Power analysis is included from the start because sample size planning under equivalence constraints is different from planning under difference constraints, and I kept getting that question after the paper.
The .plot() call on any results object produces an eight-panel figure. Panel G is the exclusion breakdown.
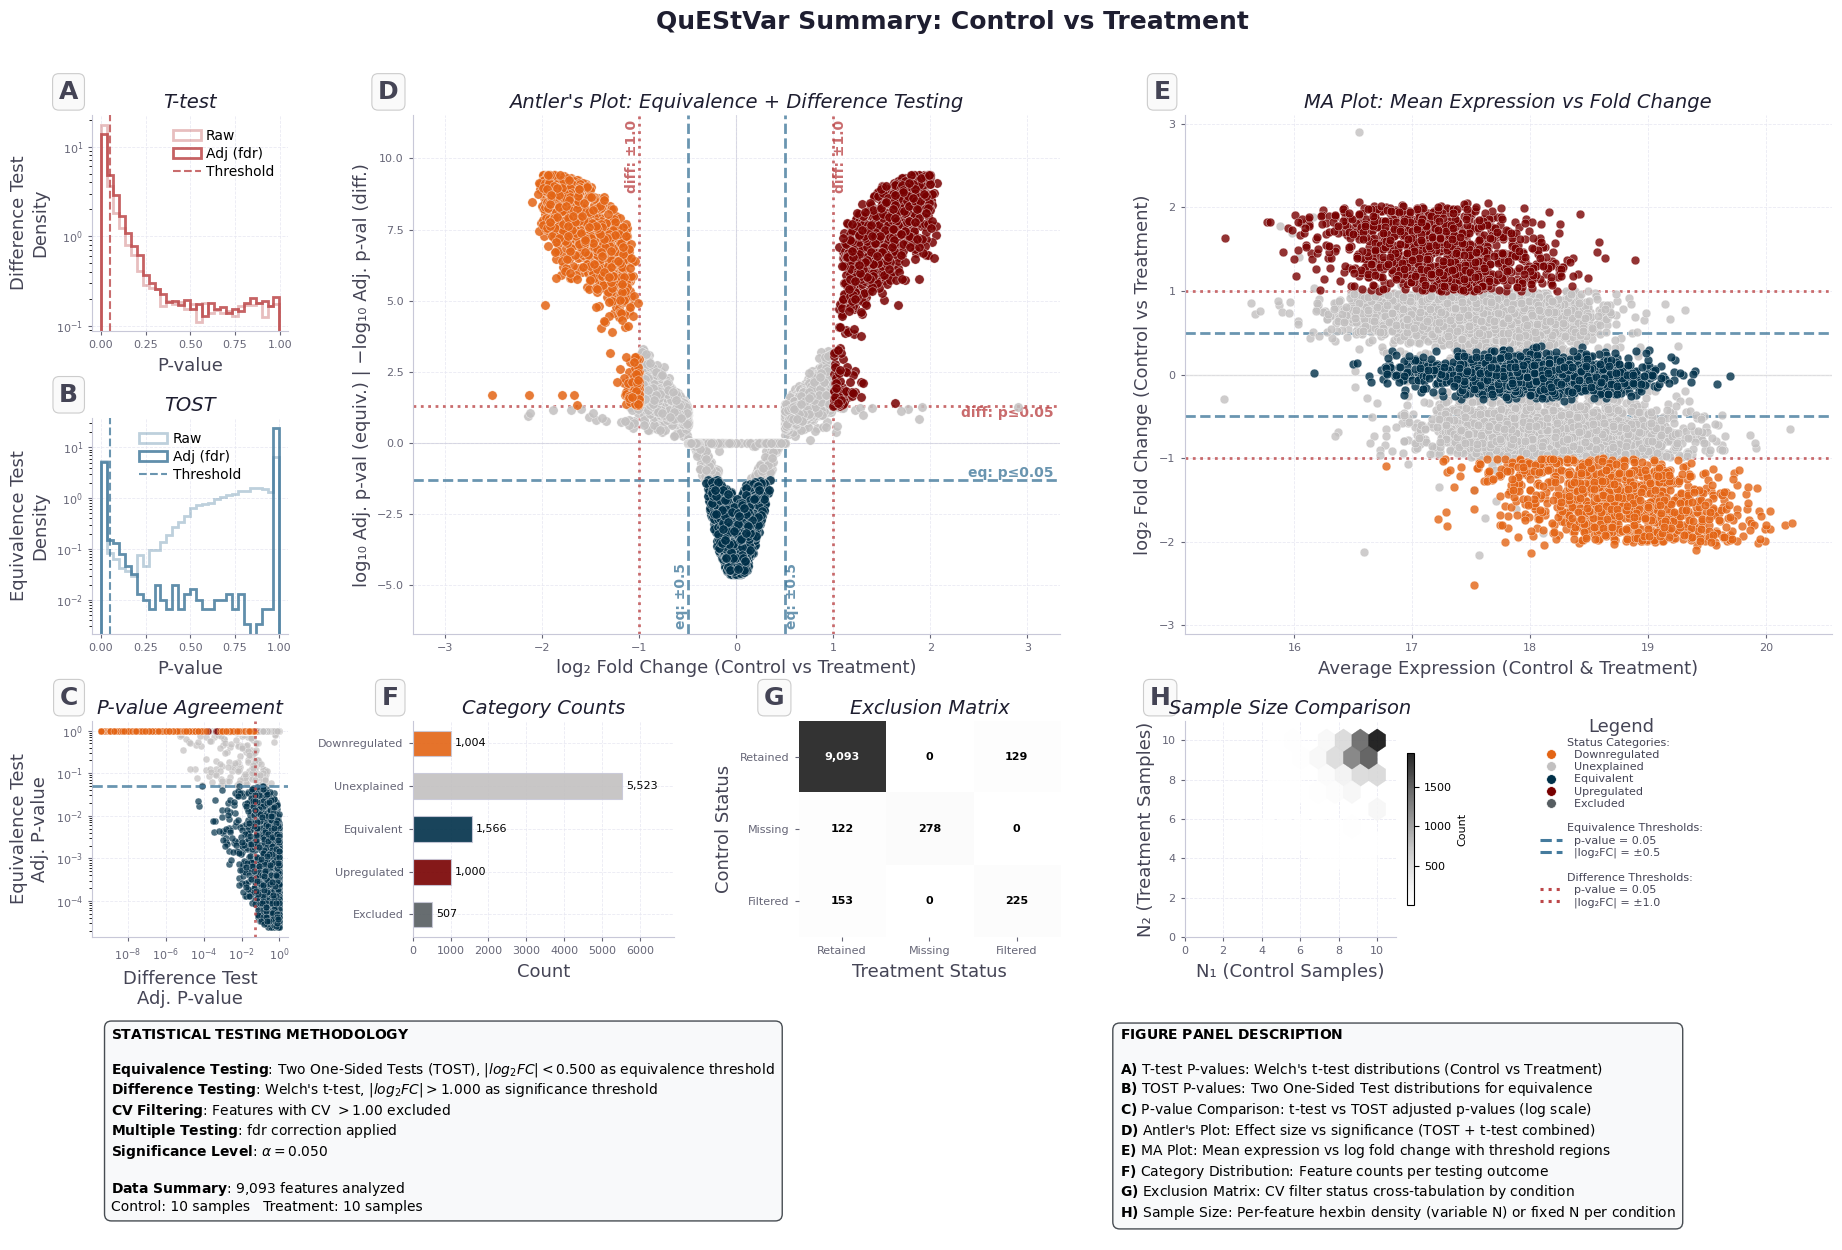
Figure 1. Summary plot from a single comparison.
v0.1.0 is single-comparison only. Multi-comparison support (metadata-driven pair generation, batch execution) is next.